What Are Metrics And Dimensions?
In this article we’re going to take a look at one of the basic concepts of data and data analysis: metrics and dimensions.
When you’re working with data it’s important to know what you’re working with. And your data is made up of metrics and dimensions.
Let’s break them down and look at the characteristics of both of these types of data points. Then we’ll take a look at an example data set so that we can identify instances of each.
Metrics
Let’s start with metrics and the first thing to know is that they’re quantitative data points. Which basically means they’re used for quantifying or measuring things.
As such they’re always numbers. Now, although all metrics are numbers, not all numbers in your data will be metrics and I’ll explain this in a minute when we look at our dataset.
For the purposes of data analysis and visualisation, metrics are an essential element of all ‘queries’. A query is simply a question you ask of your data, like “what’s my total revenue for the year?”
Without a metric you cannot visualise data in any meaningful way.
And finally, when analysing data, metrics will always have an aggregator attached, like SUM, AVG, MIN or MAX (among others). Again, I’ll show you what this means when we look at the dataset in a minute.
So, to summarise:
Quantitative
Numbers
Essential in all queries
Always have an aggregator attached when used in analysis
Dimensions
Now let’s break down dimensions.
So, whereas metrics are quantitative, dimensions are the qualitative data points so used to measure the quality of something.
9 times out of 10, dimensions will be text data points but they can also be numbers and I’ll demonstrate this in a minute.
Dimensions are essential for visualising data. Without them you cannot create charts and graphs because they are used to break down the metrics.
So, to summarise:
Qualitative
text (normally)
Essential to visualise data
used to break down metrics
Example
So now that we have a basic understanding of what metrics and dimensions are, let’s take a look at an example dataset and identify them.
Now here’s my data in excel which is just a standard dataset in a rows and columns structure.
So if metrics are the numbers, here, that means Order Quantity, Profit and Unit Price. But you may notice that Order ID is made up of numbers as well. But this isn’t a metric because it is not Quantitative which is the first characteristic of metrics we saw. Instead Order ID is a dimension because it’s Qualitative, along with Delivery Class, Region, Customer Segment, Product Category and Ship Date.
Going back to metrics for a second, we talked about them always having aggregators, what I mean by this is that when I highlight one of my metrics columns, at the bottom of the sheet (if you have the Excel option activated), you can see what the SUM, AVG and the COUNT of the numbers in the column are.
I mentioned earlier that dimensions are essential for visualising data and here’s what I mean.
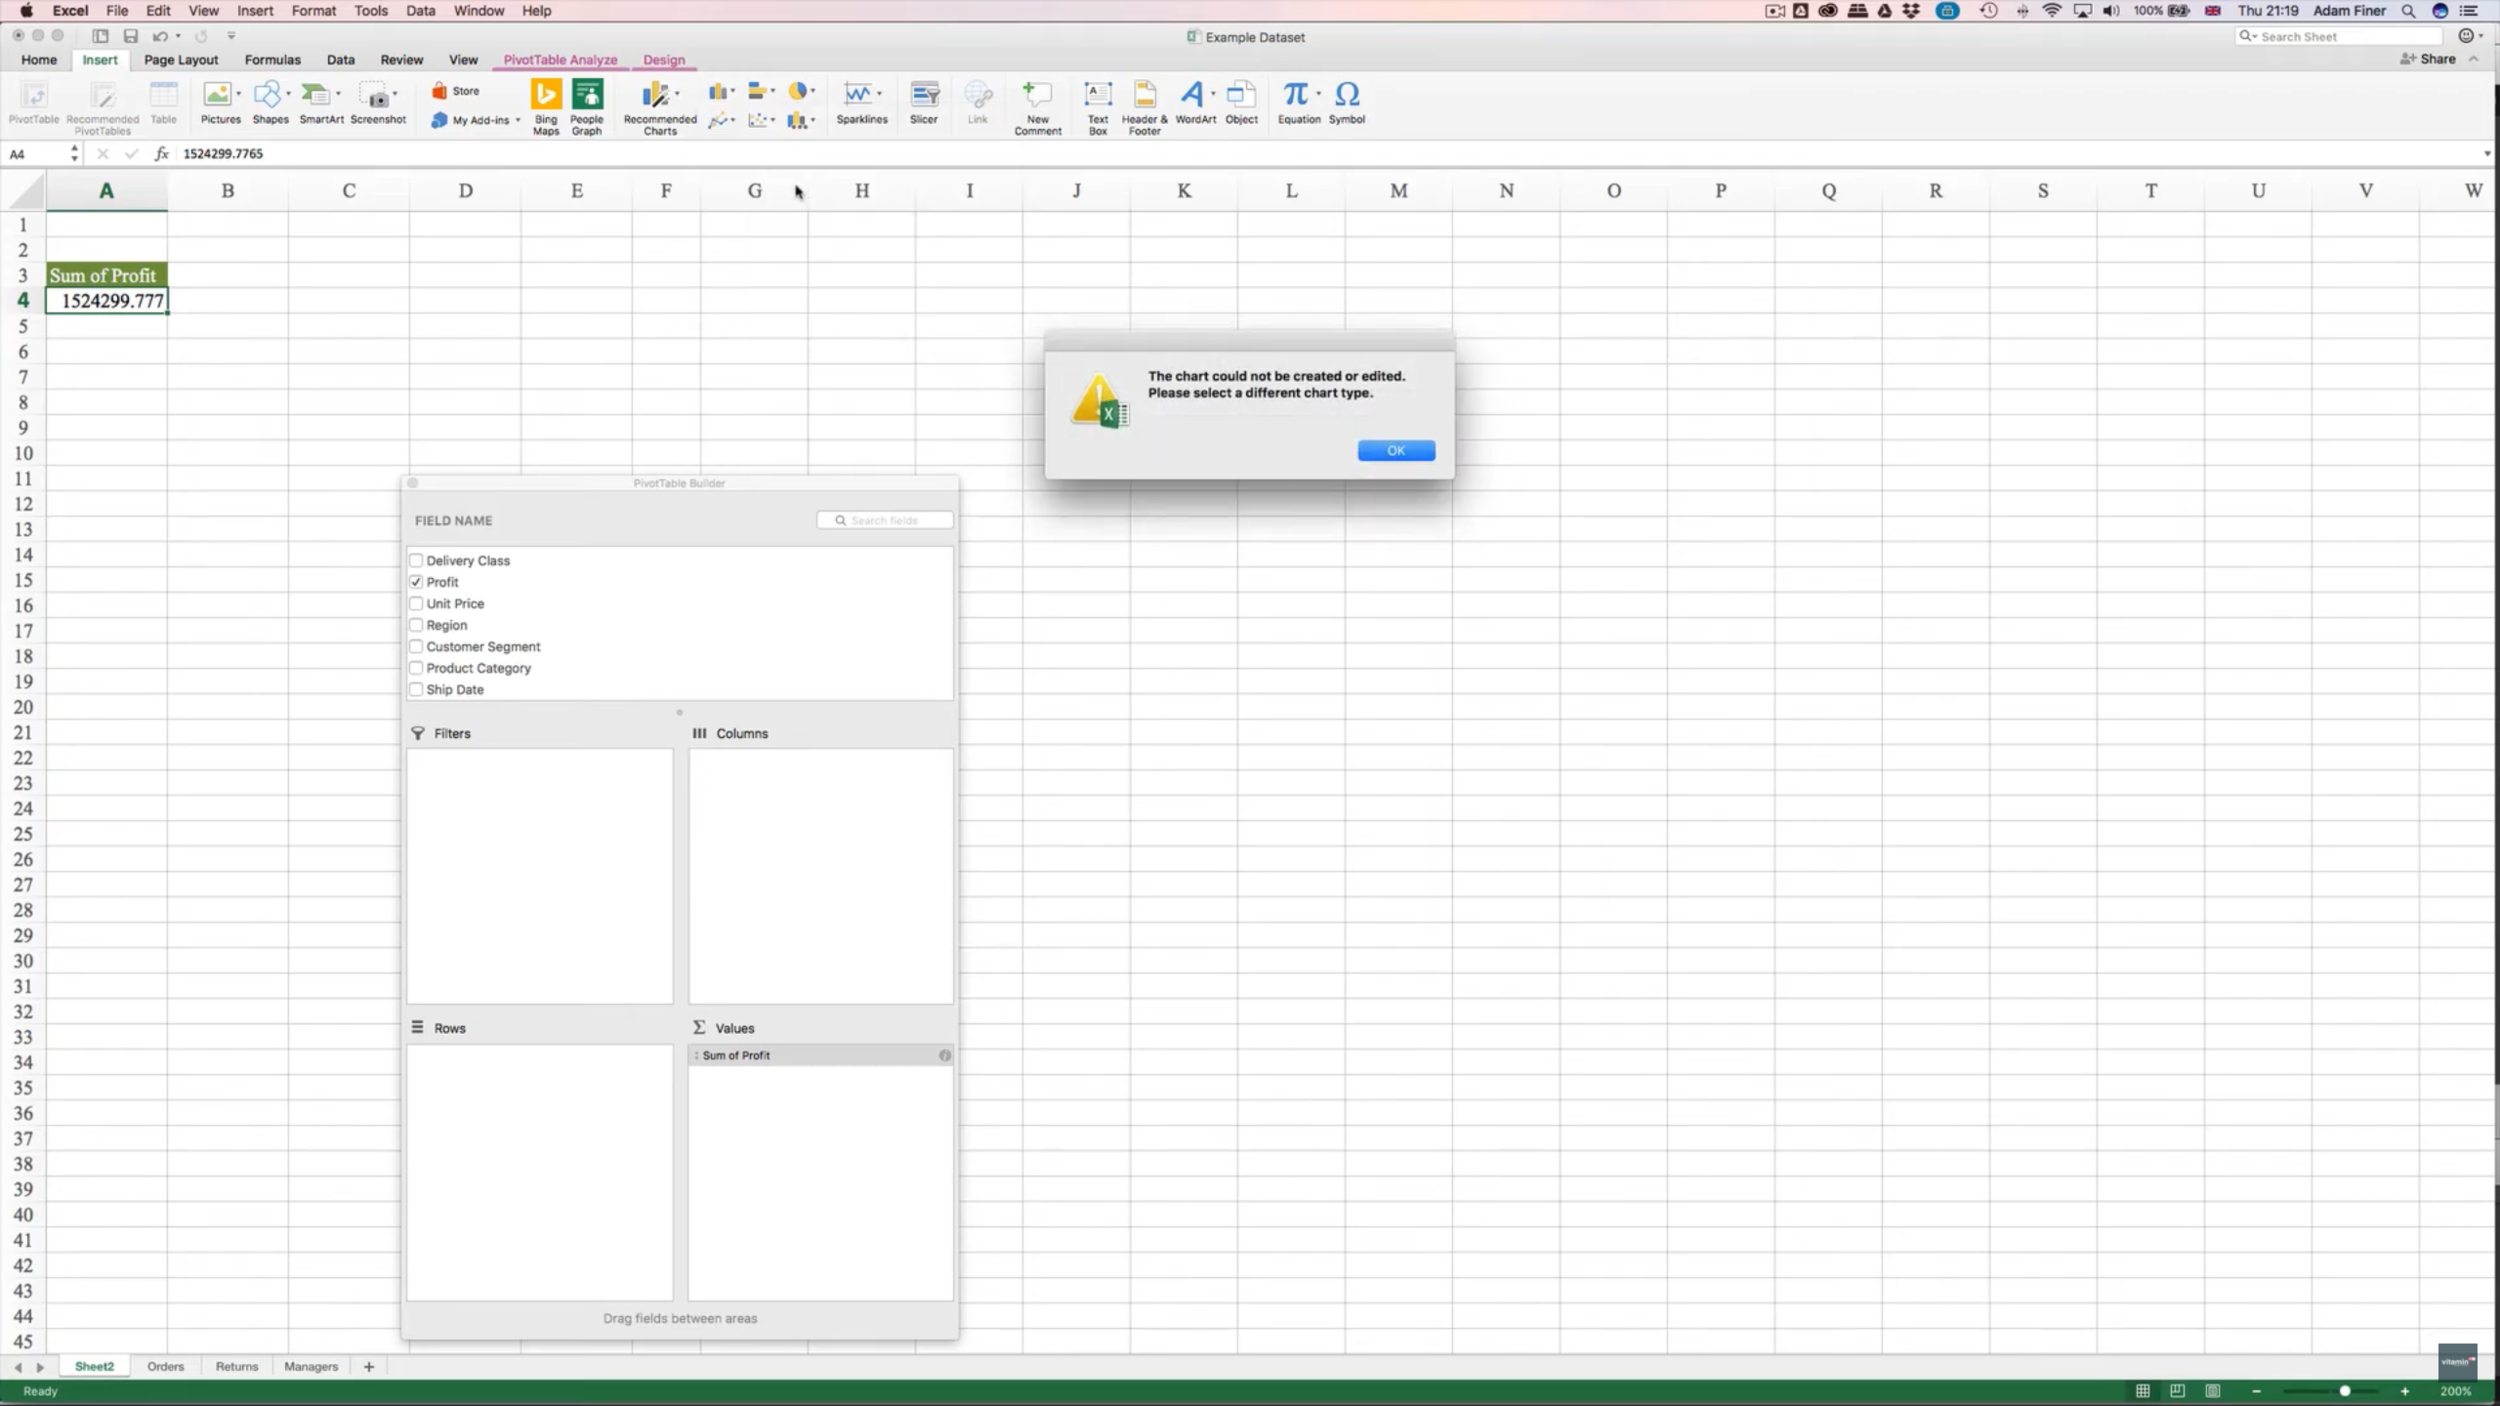
Here I have a pivot table (check our introduction to pivot tables) and I’ve added our profit metric as a value which is giving me the SUM of all the values in the profit column.
If I try to create a chart of this single figure I’m going to get a message telling me I can’t.
In order to visualise this sum of profit I’m going to need to break it down by a dimension, say Customer Segment. And when I do this I can create a chart of this data like this. You can see my metric is being broken down by my dimension to create my chart.
I also mentioned earlier that metrics or numbers can be used as dimensions as well, here’s an example. If I put order quantity, which is a metric, into rows you can see that the result is showing me the different values in my order quantity column and the corresponding sum of profit for those rows where those quantity values occur. What’s happening is that the order quantity metric is being treated as those it’s qualitative or contains text values
So, hopefully you now have a better understanding of what metrics and dimensions are and how they are used in data analysis and visualisation. To learn more BI basics why not check out 7 Business Intelligence Terms Everyone Should Know


