
Building GA4 Reports Using BigQuery
A few months back, out of the blue, Google imposed strict quota limits on the Google Analytics 4 API which threw a rather large spanner in the works for a lot of people’s reporting. Essentially it made a lot of reports and dashboards unusable.
Saying this, I tested the API the other day and found that it was a lot more usable than before so perhaps Google has relaxed the quota limits. In any case, it could revert to how it was before at any time so I still think it's best to find an alternative.
So, at the time the new limits were introduced, I made a video explaining what they were and the alternative solutions that Google proposed for getting around them.
One of them was to link your GA4 property to Google’s BigQuery and export the data there. Then connect your BI tool to BigQuery and build reports that way.
However, if you actually managed to do this (and it is fairly simple to do), you probably took one look at the data and wondered what exactly you were looking at, especially if you’re not someone like me who’s used to working with and manipulating data.
So, in this article, I’m going to teach you how to make sense of this data so that you can build your reports in whatever BI tool you use. Let’s jump in.
So, the tool I’ll be using in this tutorial is one that a lot of people who build reports with Google Analytics will also be using, Looker Studio. But if you use a different tool like Power BI or Tableau, don’t worry. The main idea behind this tutorial is to help you to understand how the data is collected and stored. Which in turn will help you to create any calculations and custom fields you might need using your specific tool. So it’s more about method than practice.
But before we get on to working with the data, there’ll be some of you who haven't already linked your GA4 property to BigQuery yet, so I’ll show you how that’s done first. If you’ve already done this, you can just skip ahead.
Linking GA4 to BigQuery
First things first, if you don’t already have a BigQuery account, you’ll need to set one up. This can be done here. Make sure that you also set up a Project in your BigQuery account because this is where you’ll store the data.
Once your BigQuery account is set up, you’ll need to go to the Admin section (gear icon bottom left) in Google Analytics. Select the property you want to link and then scroll down to the ‘Product Links’ section at the bottom of the page. Select ‘BigQuery Links’, hit “Link” and follow the instructions.

You’ll need to choose a BigQuery project to export to. Select your project. Then on the next page you’ll choose the location of the Google servers where you’d like your data to be stored.
If you’d like to exclude any events from the export, you can do this by hitting “Configure data streams and events”. And, finally, you will need to specify the frequency at which the data will be exported to your BigQuery project. This can be either live (streamed data) or daily, depending on your reporting requirements.
And that’s it. Data will now start automatically exporting to your BigQuery project. Totally painless. You do need to bear in mind though that no historical data will be exported, only data from the date that you set up the export.
You can backfill GA4 data into BigQuery but that’s not the aim of this video. If you’d like me to make another video showing you how to do that, please hit the like button and let me know in the comments below.
One other thing you might want to do is to combine data from your old Universal Analytics property with your new GA4 one to give you some continuity with your reporting. Well, it just so happens that’s something you can do easily with the one of our partners, Latitude.
If you’re wondering about the cost of streaming this data, Google states:
“You will incur additional BigQuery costs for using streaming export at the rate of $0.05 per gigabyte of data. 1 gigabyte equates to approximately 600,000 Google Analytics events, though that number will vary depending on event size.”
So not expensive at all.
Once the data starts exporting to BigQuery, it looks like this:
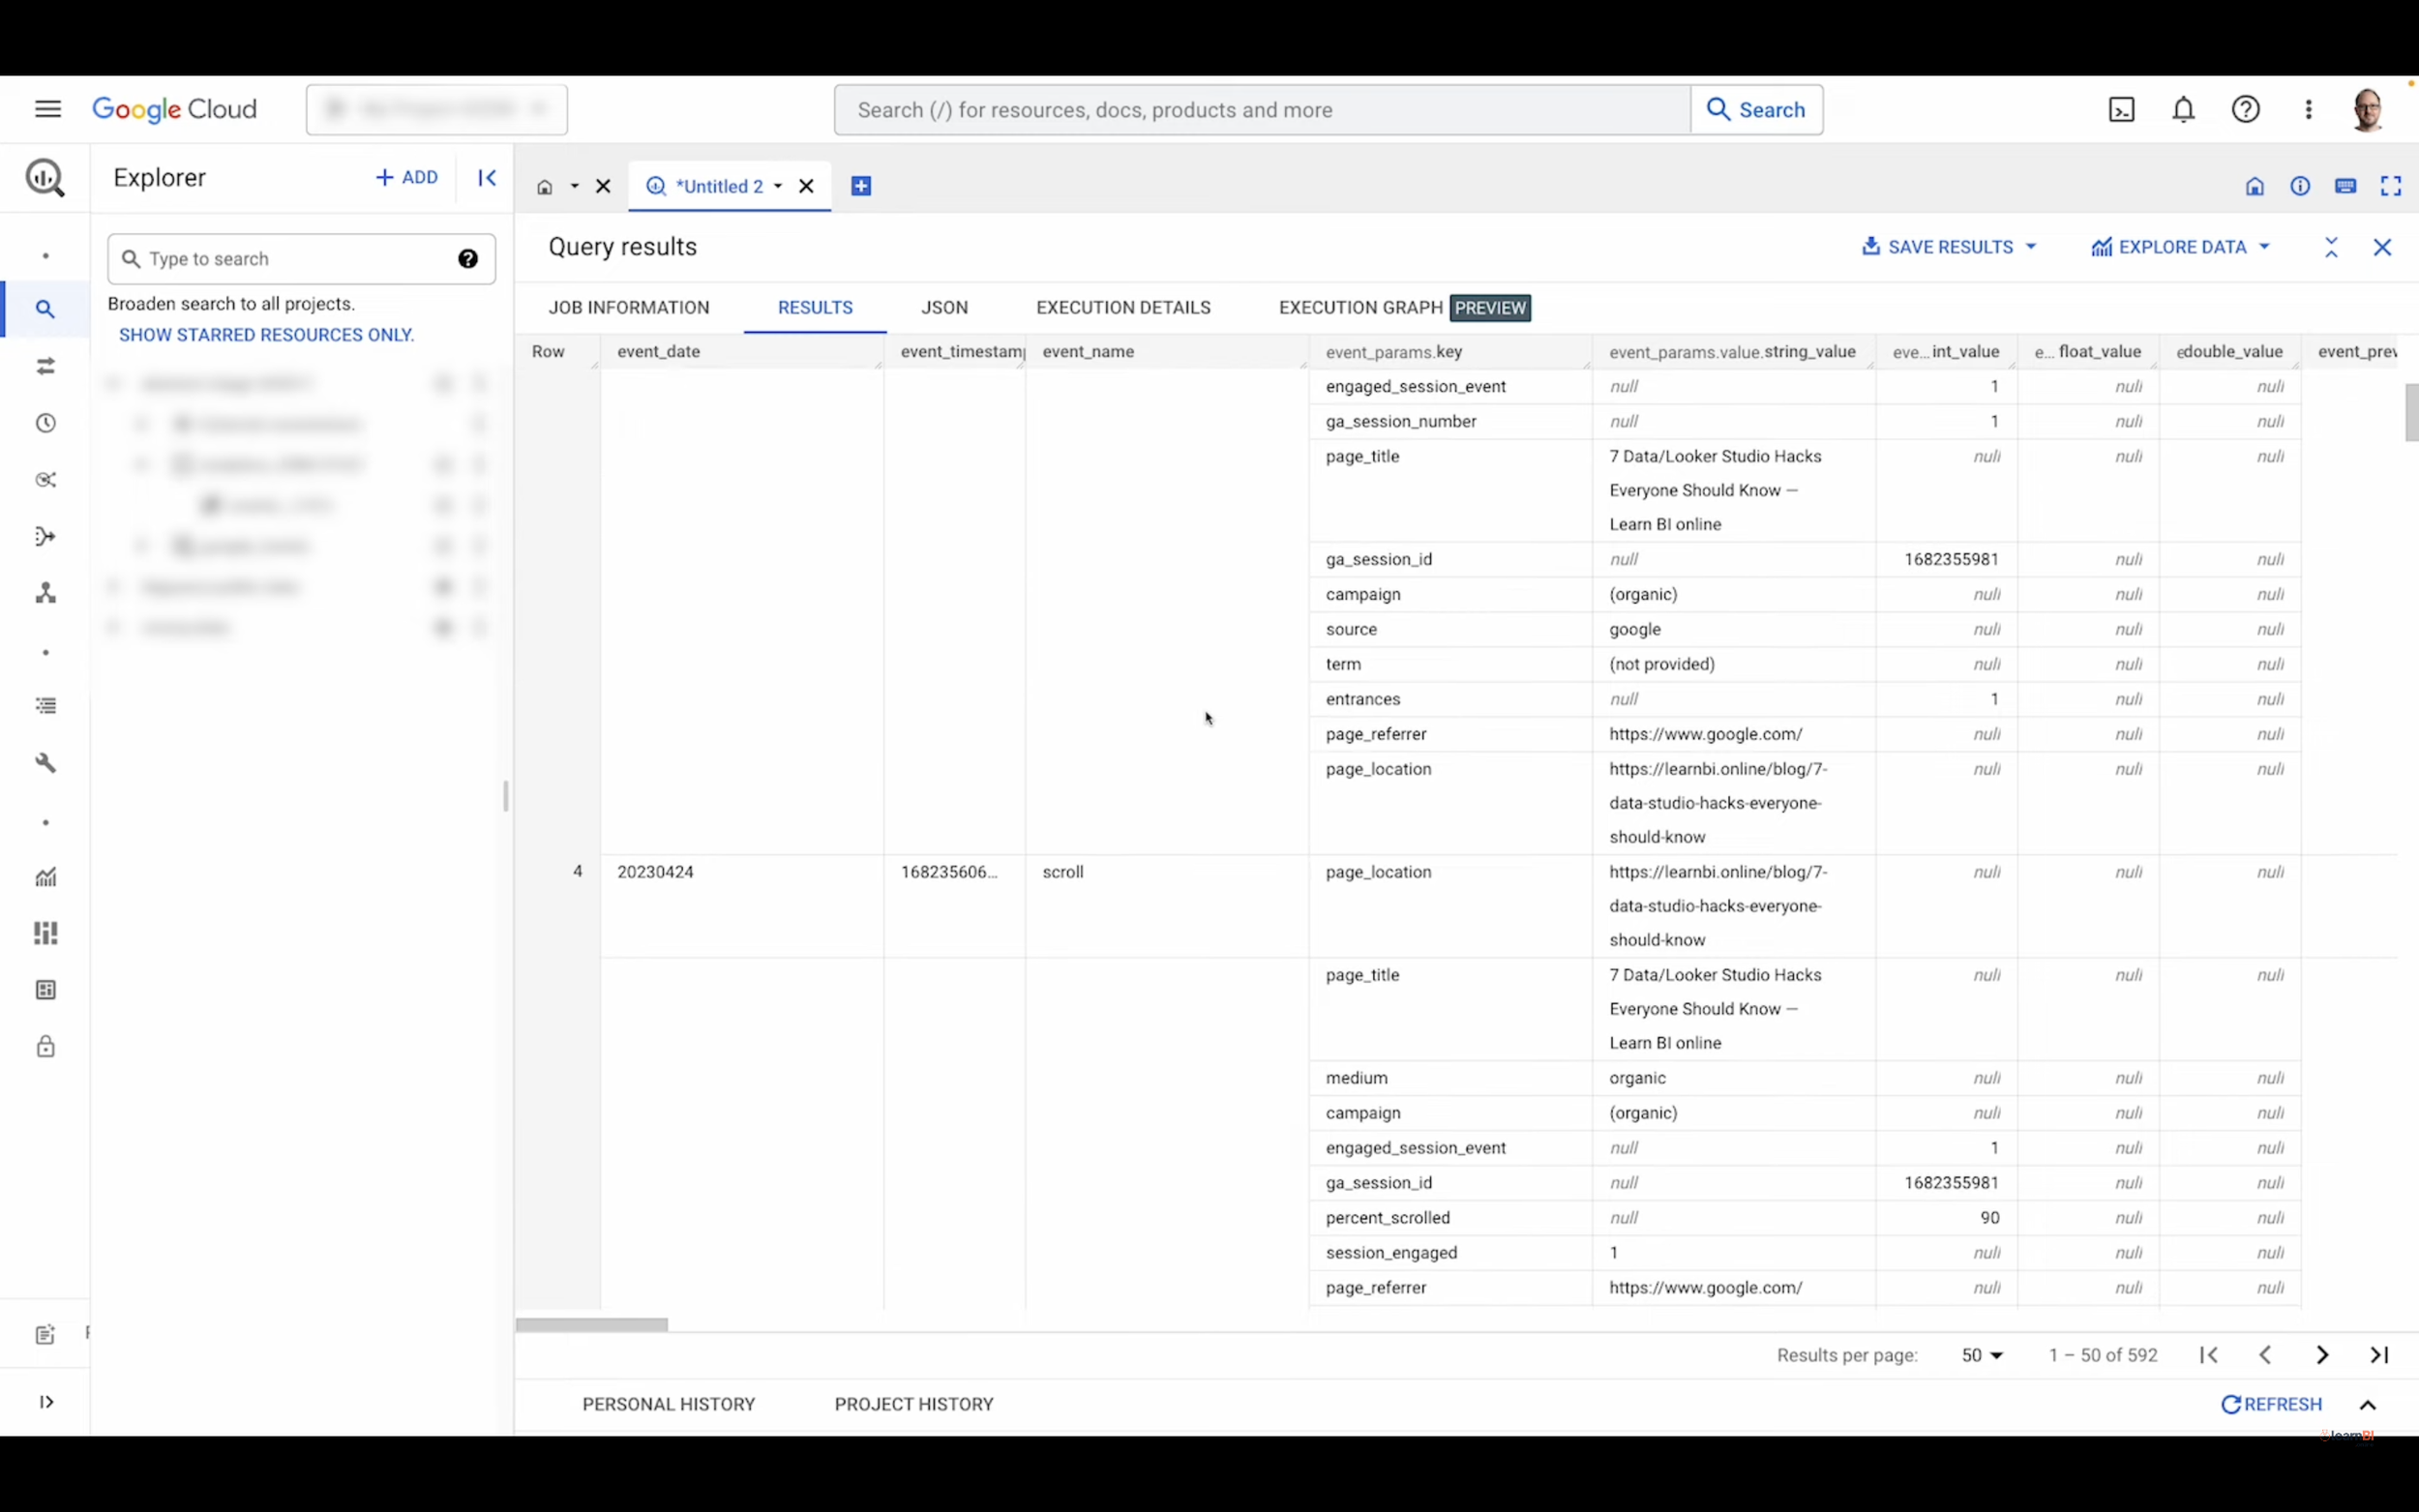
GA4 data is collected as events and all of the different events are kind of tangled up together. This means that we need to try to untangle them by separating them out using filtering and calculations. If you want more detailed information about the data source’s schema, check out the article here.
Connecting BigQuery to Looker Studio
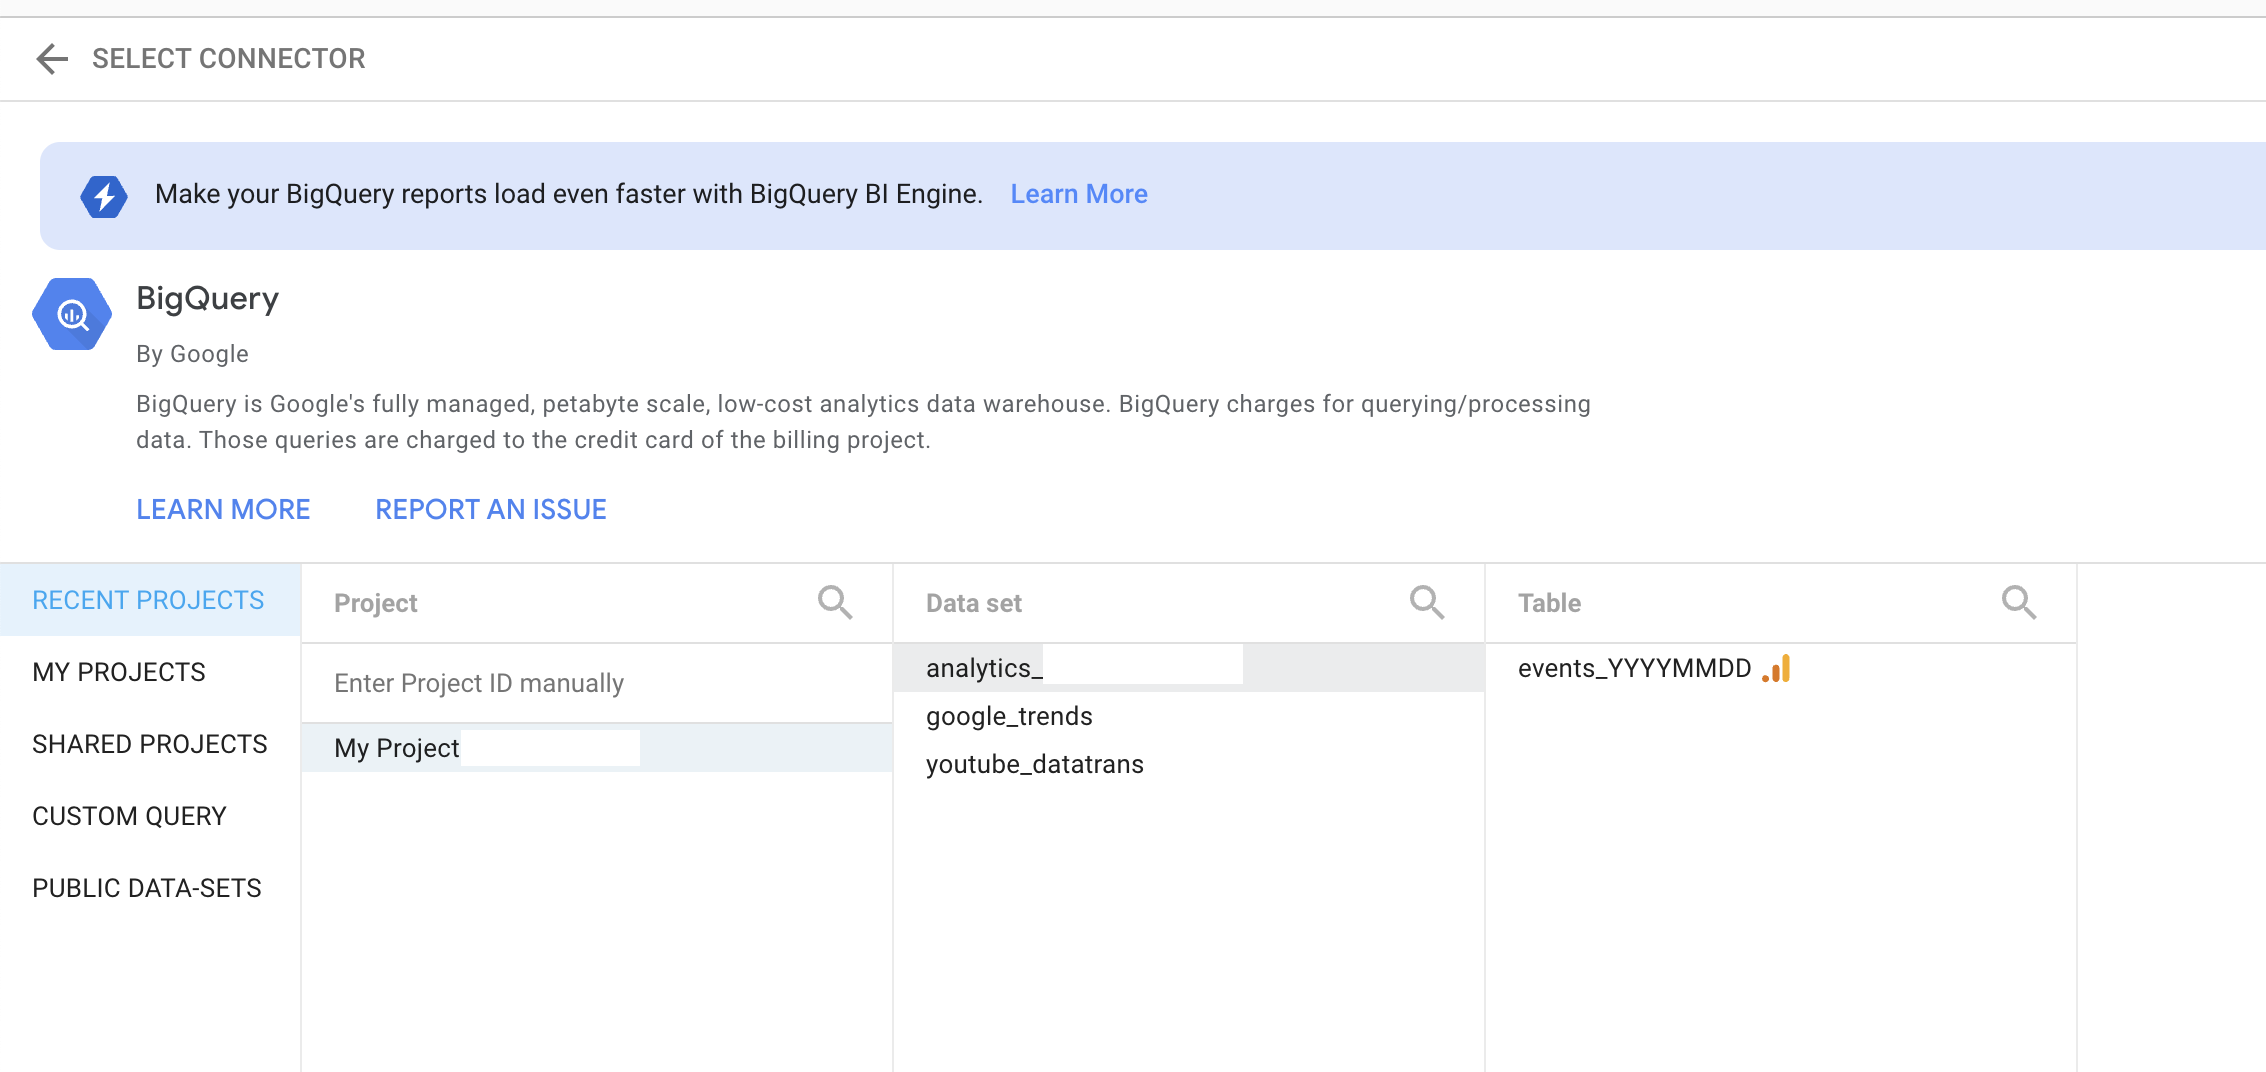
Next you’ll need to connect BigQuery to Looker Studio which is very simple. You just need to create a new data source, select the BigQuery connector, and navigate to your events table located in your project. You’ll need to check the ‘Events’ radio button as well.
Once this is done we’ll create a new report. What you’ll notice when you look at the fields available on the right is that the original field names have been substituted with more recognisable ones, making the data easier to understand.

Let’s take a look at the basic structure of the data.
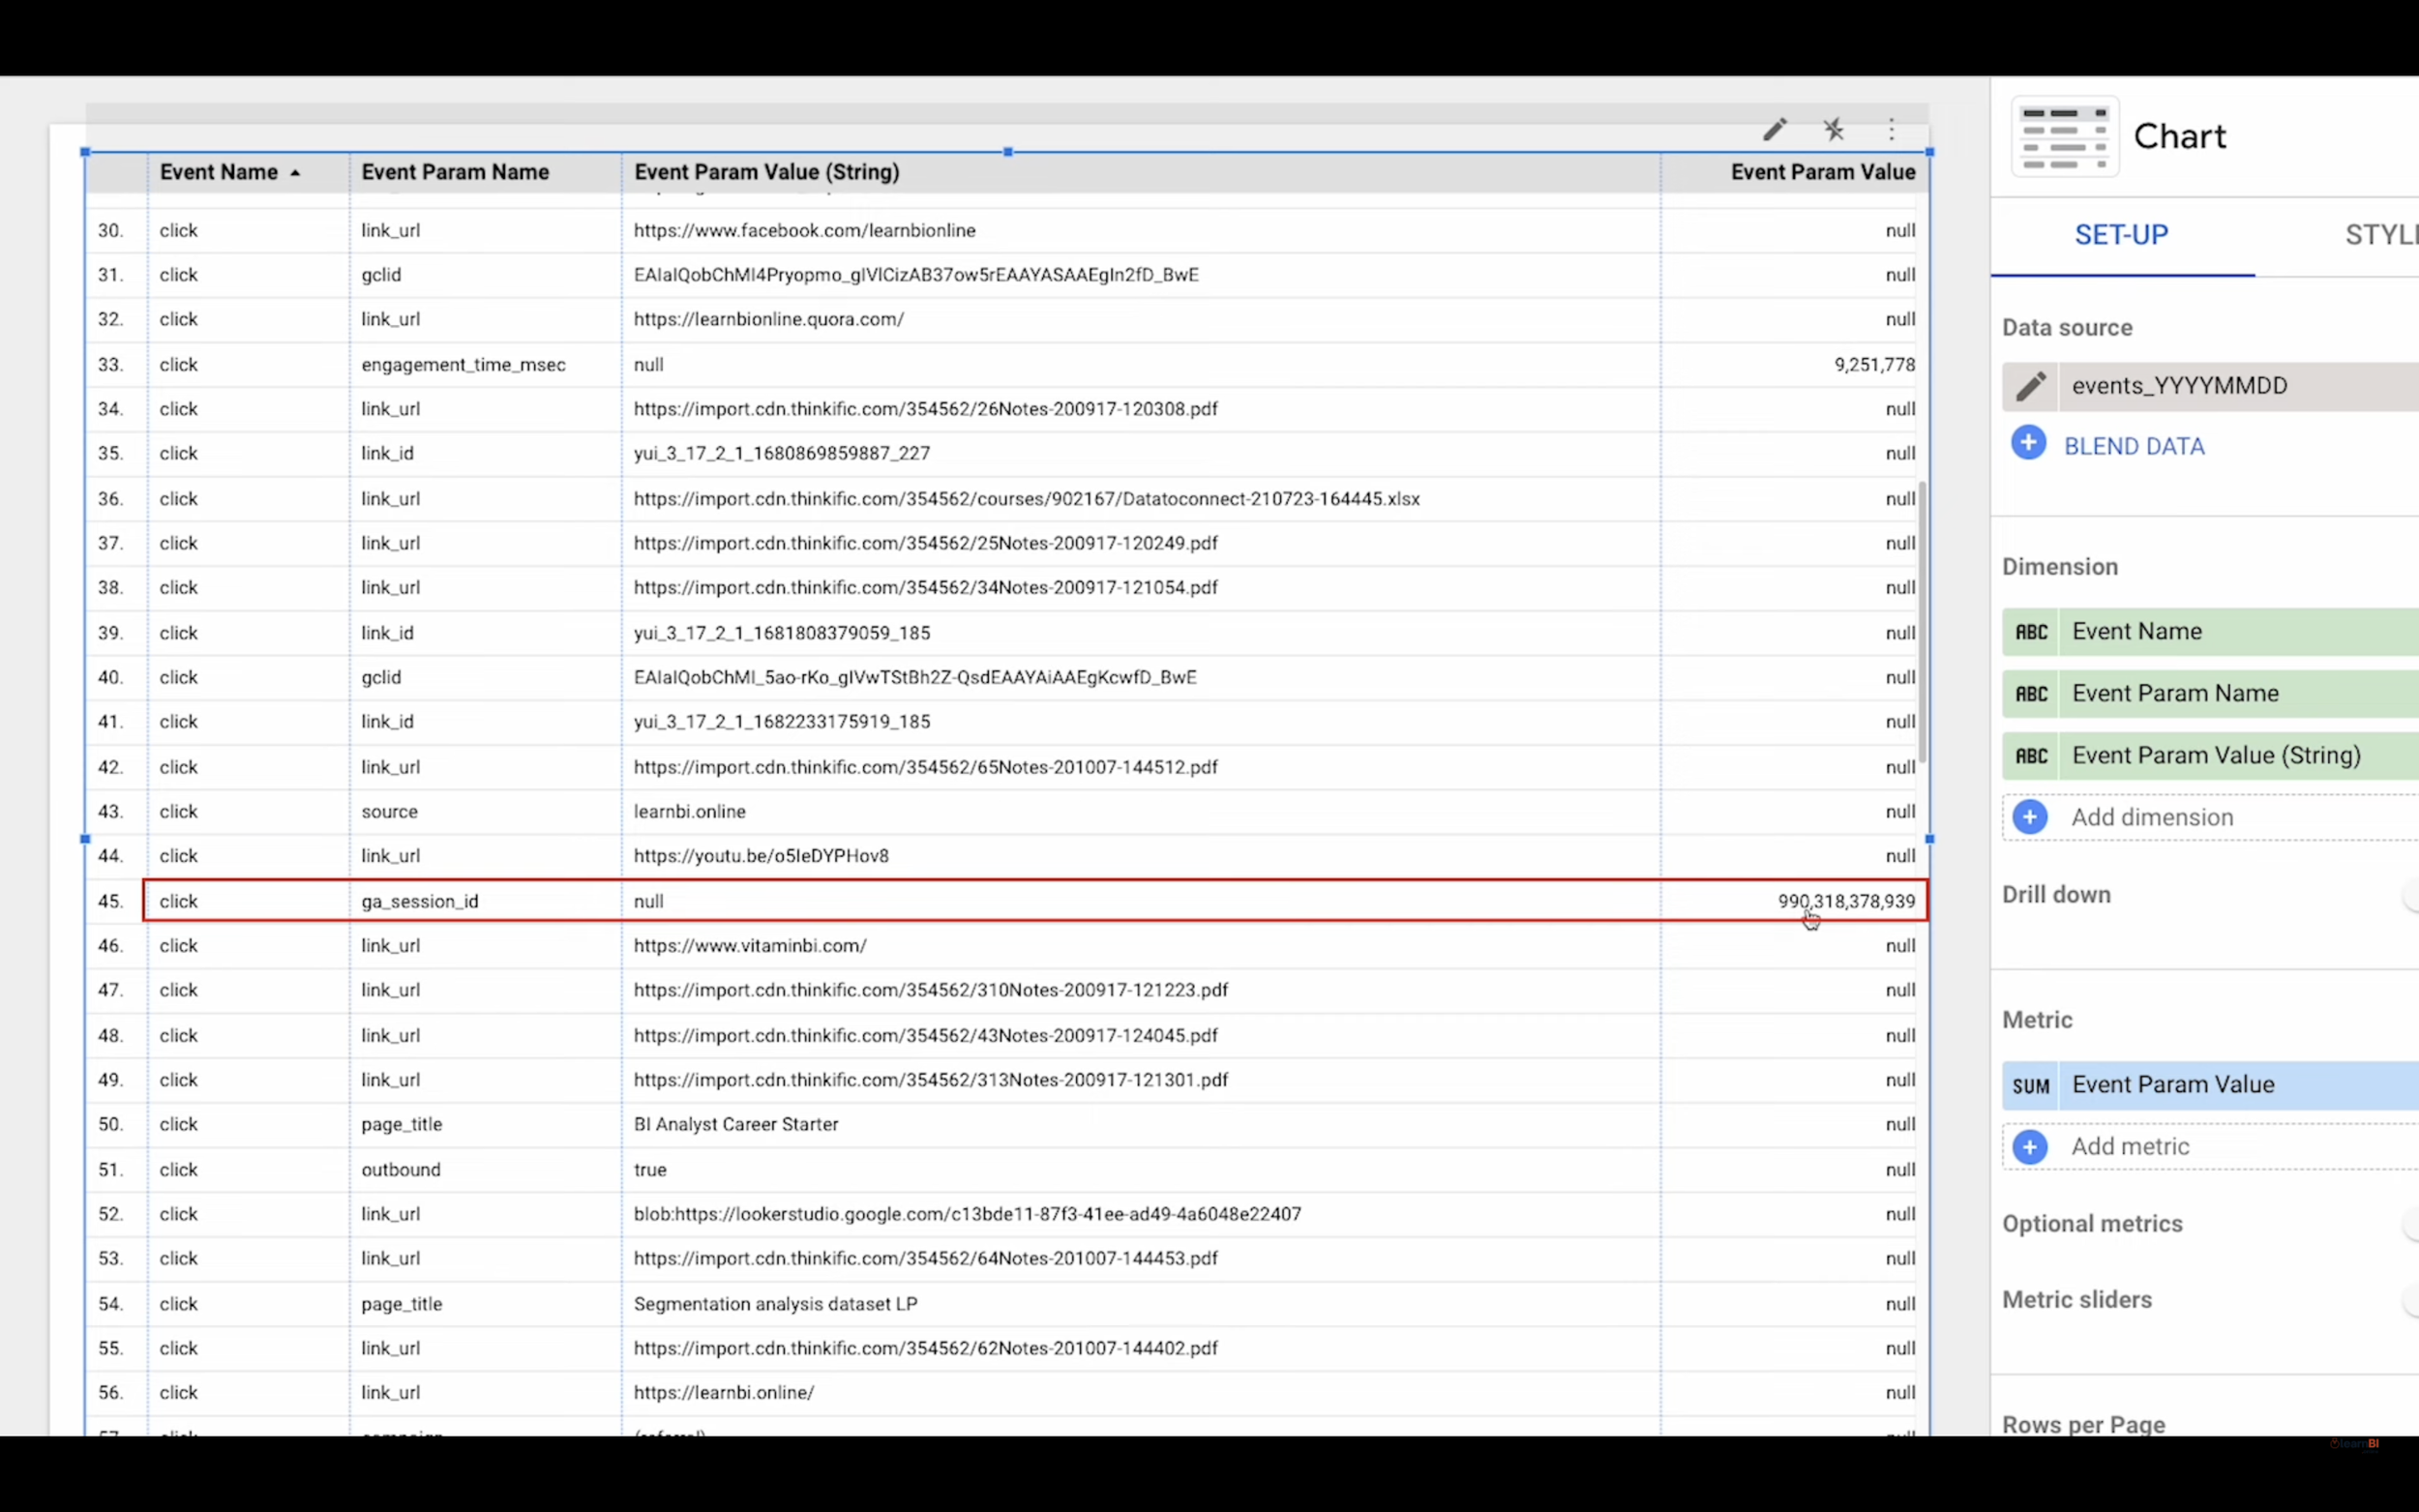
As we know, GA4 data is based on events so when you add Event Name to the query you’ll see the top-level events that data is collected for. These are just the standard events, if you’ve created custom events they should appear here too.
Then for each event, we also have event parameters. So when adding those to the query you’ll see that, for example, the click event has parameters like page_title, link_url, ga_session_id etc.
Then, each of these parameters has a value, either a string (text) or numeric. These values are contained in the Event Param Value (string) dimension and Event Value metric.
For the click event and the source parameter, we can see the different string values and for the ga_session_id parameter, because it’s a number, we can see the aggregated sum of all of the ga_session_id values. Make sense? Hopefully, at this point, you’re having a eureka moment. Next up we’ll build out some of the standard GA4 metrics in Looker Studio using functions and formulas.
Building GA4 Metrics & Dimensions in Looker Studio
One thing to note is that you may see some discrepancies between the figures you see in the Google Analytics interface and those you see from the calculations you’ll create. This is normal and is explained by Google in this article.
First, Sessions. As we have already seen, there is a ga_session_id event parameter. According to Google:
The standard method of counting sessions for Google Analytics 4 properties is counting the unique combinations of user_pseudo_id/user_id and ga_session_id regardless of the timeframe.
So, in order to calculate the number of sessions, we need to concatenate these two things using the following formula:
CONCAT(CASE WHEN Event Param Name='ga_session_id' THEN Event Param Value END,User Pseudo ID)When we add this calculated dimension to a scorecard, we can see that the distinct count aggregator (CTD) is being used by default which gives us the correct result.
Next, we’ll want to calculate engaged sessions. This is not so straightforward because it involves unnesting data in a way that’s not really possible in Looker Studio. The best way to do it that I’ve found is to simply use the session_engaged event parameter name and the corresponding parameter value. When I compared the figures with what I see in the GA4 interface they match almost exactly so I’m pretty confident the calculation holds water. If you know a better way, please let me know in the comments.
So, in a new field we’ll call Engaged Sessions, we’ll write the following formula:
CASE WHEN Event Param Name='session_engaged' THEN Event Param Value ENDThe Event Param Value is one or zero so the sum aggregator will sum up the one values in the relevant rows and we get our engaged session count.
Now that we have these 2 metrics we can calculate the Engagement Rate which is the number of engaged sessions divided by the total number of sessions. Let’s create this field. We need to remember that sessions uses count_distinct so the formula is:
SUM(Engaged Sessions)/COUNT_DISTINCT(Sessions)And then we’ll add that to the report. Let’s turn it into a percentage.
Conversely, the Bounce Rate is simply 100% minus the engagement rate so we can create that metric easily with this formula:
1-Engagement rateWe’ll do one last one in terms of engagement before moving on to Users, Average Engagement Time Per Session. To calculate this we have the event parameter name engagement_time_msec which is the time in milliseconds.
We’ll first need to translate that to seconds by dividing by 1000 so the formula here would be:
CASE WHEN Event Param Name='engagement_time_msec' THEN Event Param Value/1000 ENDOnce we have calculated this, we can then create the final metric with the formula:
sum(engagement time seconds)/count_distinct(Sessions)So, we’ve now got 5 different metrics. Let’s move on to users.
For Total Users, it’s very simple because we actually have a Unique Users metric already available. Or, another way to calculate it would be to do a distinct count of User Pseudo Id, which gives us the same value.
We can actually use this Pseudo User Id to calculate New Users. We use it in conjunction with the first_visit event name and then count the distinct number of user ids. So our formula is:
CASE WHEN Event Name='first_visit' THEN User Pseudo ID ENDOnce we have these metrics built, we can then combine them with some of the existing dimensions like Source, Medium, Date and Country to build out our reports.
There is one dimension that isn’t directly available and that you’ll have to create yourself and that’s the Default Channel Grouping. Because it’s fairly complicated, I’m not going to go through it in this article. Instead, if you want to get hold of it along with all the other formulas from this video, just click here.
Now that you know how these metrics have been built, you should be able to go ahead and build out any others you might need for things like e-commerce reporting. Just recreate the table we built at the beginning so you can see which combinations of event dimensions and metrics to use
Obviously, the formulas we’ve written in this tutorial are made for Looker Studio but you should now be able to understand the logic behind them which will, in turn, help you to recreate them in your chosen BI tool.
If you don’t have a chosen BI tool yet and you’d like to learn how to use Looker Studio, I’ve made a 15-minute tutorial to help you get started.