7 Business Intelligence Terms Everyone Should Know
Like any industry, Business Intelligence has its own jargon and terms that can be confusing if you’re unfamiliar with them. In this article I’m going to break down 7 of the most common terms in BI that everyone should know.
Data Silo
A data silo is a standalone source of data that’s not connected to any others or to a centralised data repository.
Basically, most businesses generate tons of data in different places through all of their different activities. From simple Excel files and on-premise databases to social media profiles and web SaaS services.
You can even have different data silos within different departments of the same company. Sales, marketing, finance etc could all be using different internal systems that collect data and store it separately from the rest.
One of the basic premises of Business Intelligence is to harness the data from these different data silos and either use tools to query the data where it is and join or blend it with other data from other sources or transfer that data from there to a centralised repository.
Which brings us nicely on to the next term.
2. Data Warehouse
A data warehouse is a kind of database that, as the name suggests, warehouses data that’s been extracted from different places or silos. Its purpose is to bring all of this data together to serve the analysis processes of Business Intelligence.
Data warehouses contain a copy of current and historical data from the different sources which means that they can be built and configured to make analysis faster and easier while not getting in the way of the original data source which is busy collecting data.
Because the data is being extracted from its original source and loaded into the warehouse, this means that, in between the 2, the data can be cleaned and transformed to make it more compatible with the data model that best suits the business it serves.
3. ETL
Next up we have ETL which is a tool that’s named after the 3 tasks it performs. Those 3 tasks being the ones that we just talked about with Data Warehouses. ETL stands for Extract, Transform and Load. So basically, it’s job is to take data from one place, then apply transformations to it before loading into another place.
It essentially solves 2 of the main issues surrounding the data part of the Business Intelligence process. Firstly that data is everywhere in silos that aren’t necessarily connected to one another. ETLs allow you to bring all of these different data sources together into one place, like a data warehouse.
Secondly, data can be in many different formats, like a table in a database or JSON, XML CSV among others. The transform functionalities of an ETL allow you to standardise and normalise all of these different data formats, making them far easier to blend and analyse together. Another important function of ETLs is to clean data by fixing any errors that may exist in its original source. Which, in turn, ensures that the data and the results of data analysis are more reliable.
4. RDBMS
RDBMS stands for Relational Database Management System. It’s software that’s used to manage and administer relational databases. The most widely known of these are MySQL, SQL Server and PostgreSQL. Or, if you’re old school, Microsoft Access.
Data warehouses are relational databases so you need an RDBMS to manage and query it.
If you’re not familiar with what a relational database is, it’s a database made up of many different datasets that are contained in what are called “tables” because the data is in a rows and columns tabular format. The reason it’s called relational is that every one of the tables has a relationship to one or more other tables. This relationship takes the form of one or more common data fields that contain the same information. They’re called joining keys.
Structuring a database like this is an efficient way of storing data and makes data analysis faster.
If you’re getting value out of this video please do show your appreciation by hitting that like button. It helps feed the algorithm and get the channel out to more people. Thank you.
5. SQL
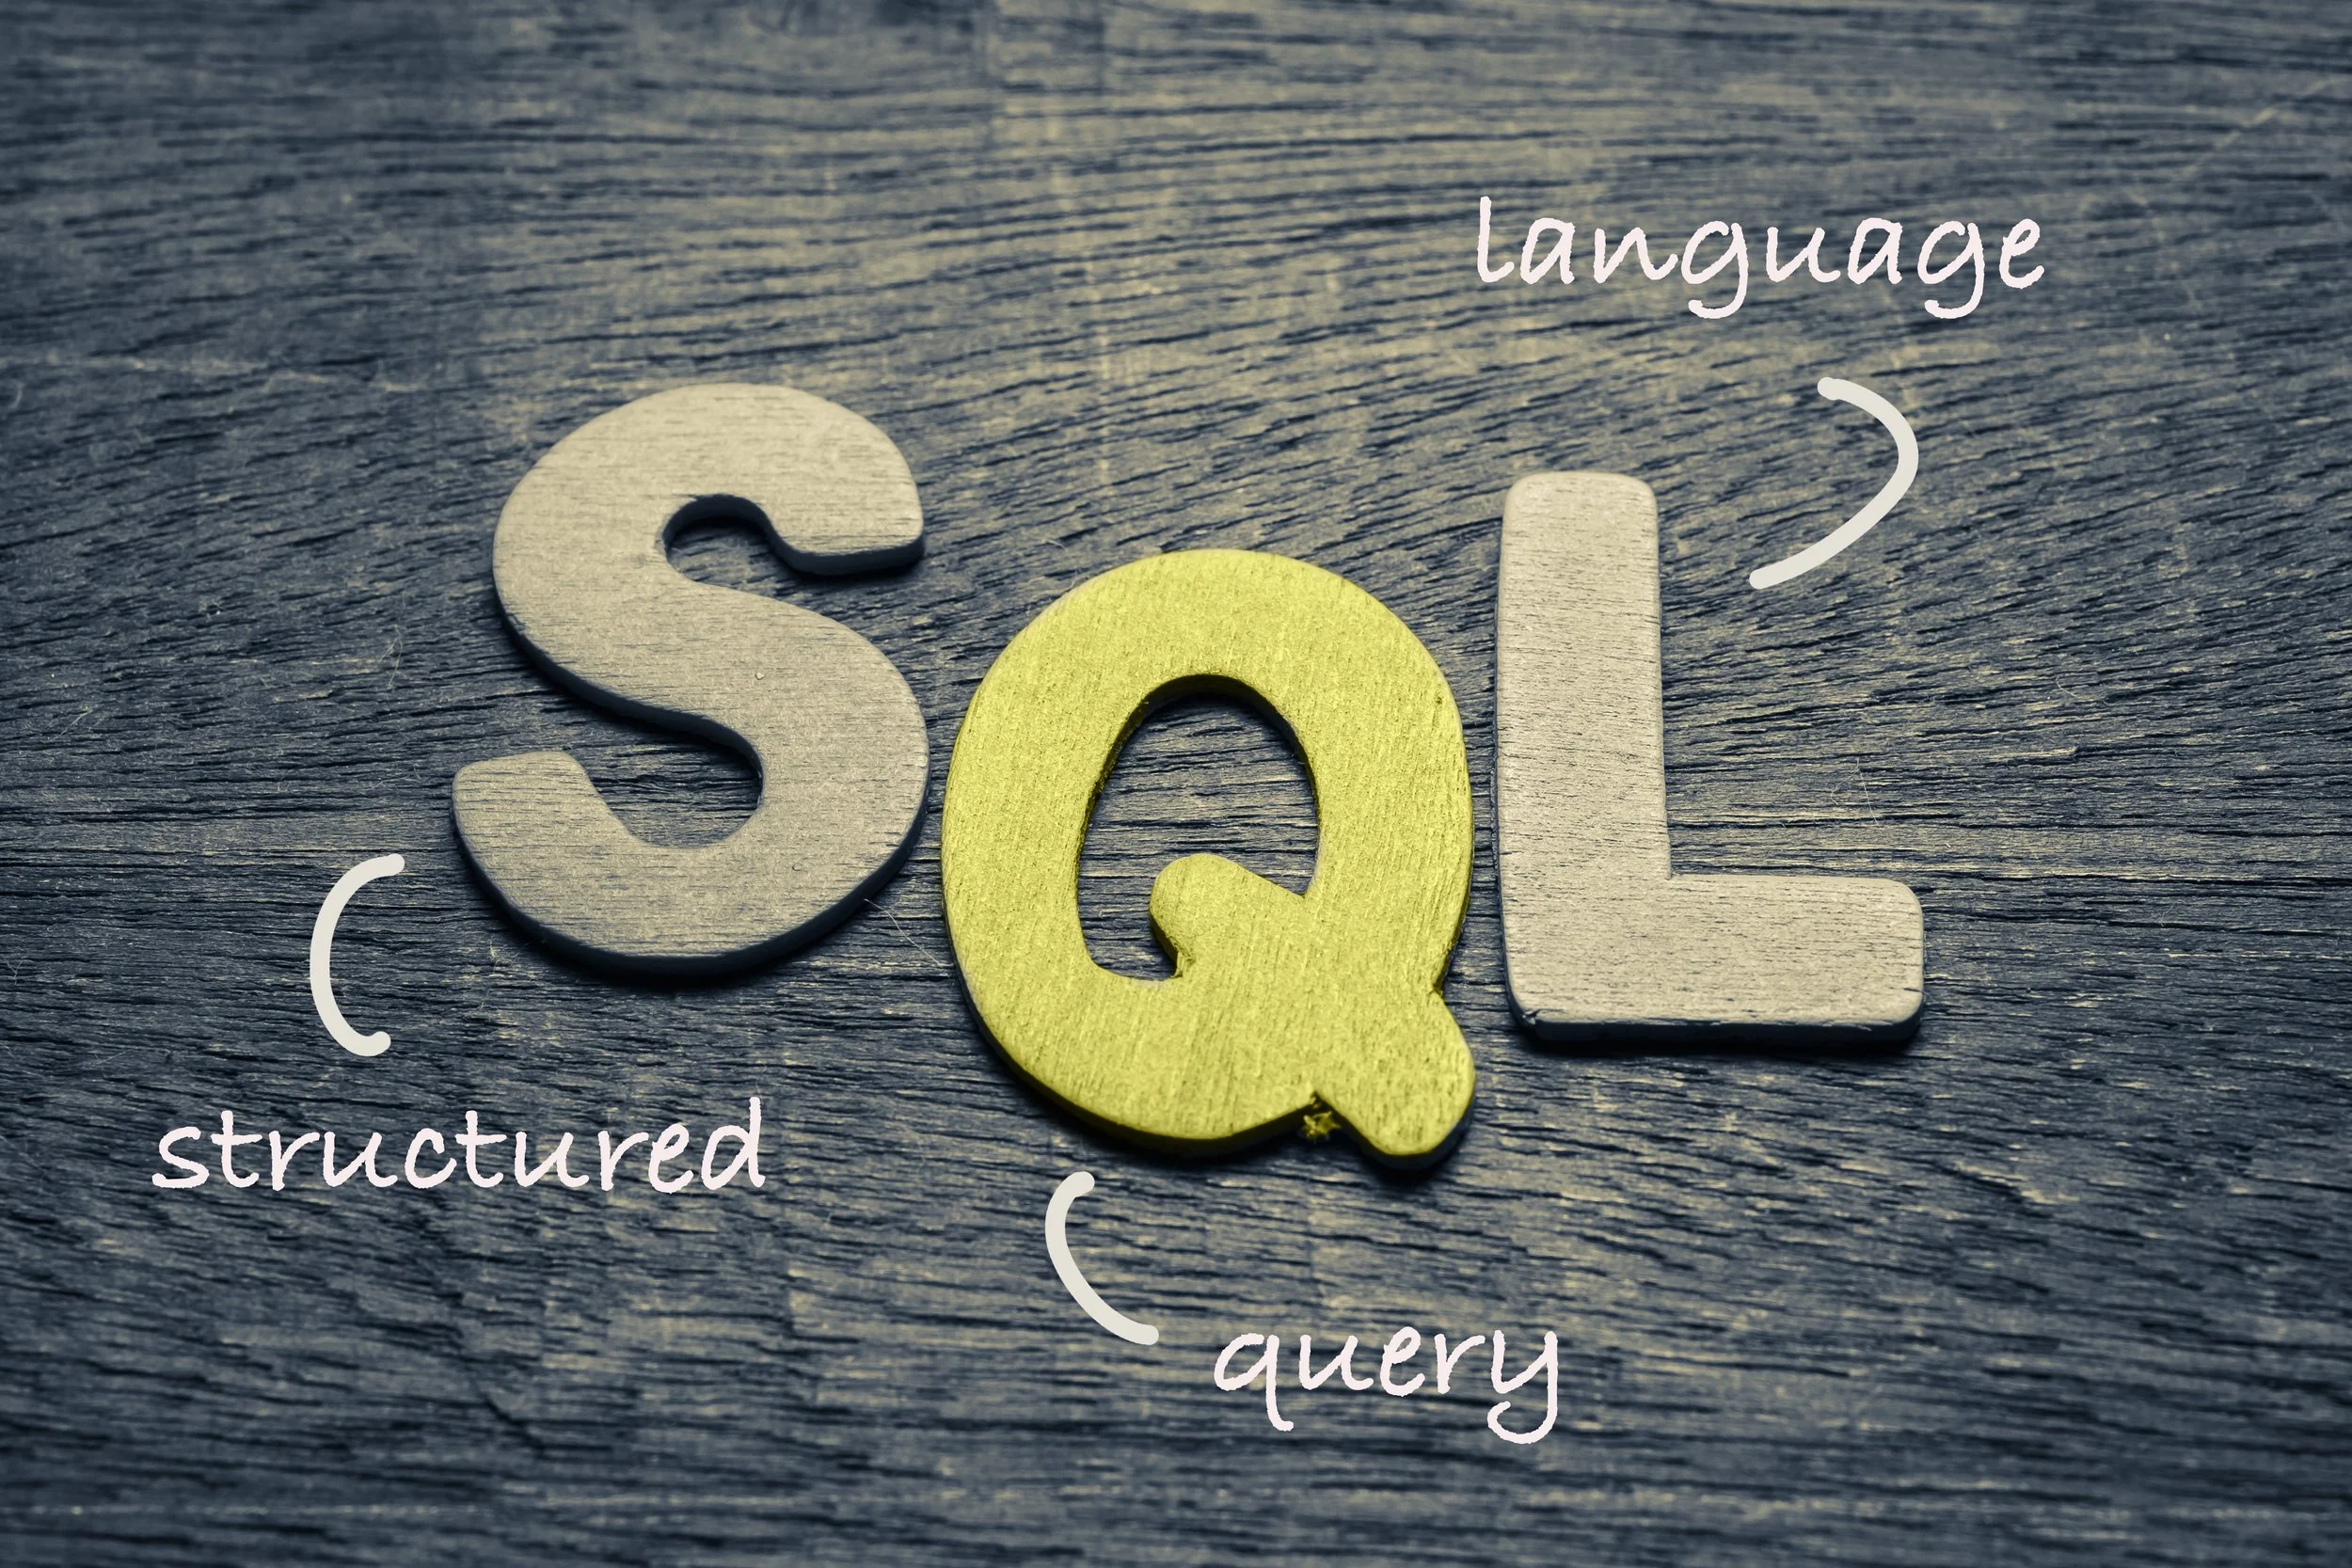
SQL, often pronounced ‘Sequel’, stands for Structured Query Language. It’s a language that communicates with relational databases or RDBMS. So, in terms of Business Intelligence, the SQL language is used to query databases and ask them to aggregate and filter data contained in its tables. Also to join different tables together. Most BI tools have some kind of SQL query engine behind them to carry out these tasks.
Each RDBMS, MySQL, SQL Server etc had its own version of SQL that differs slightly from others in terms of its syntax. But on the whole they’re all very similar.
*If you want to learn some SQL basics, check out this article. Or if you want to dive deeper and become a SQL expert, check out this course.
6. KPI
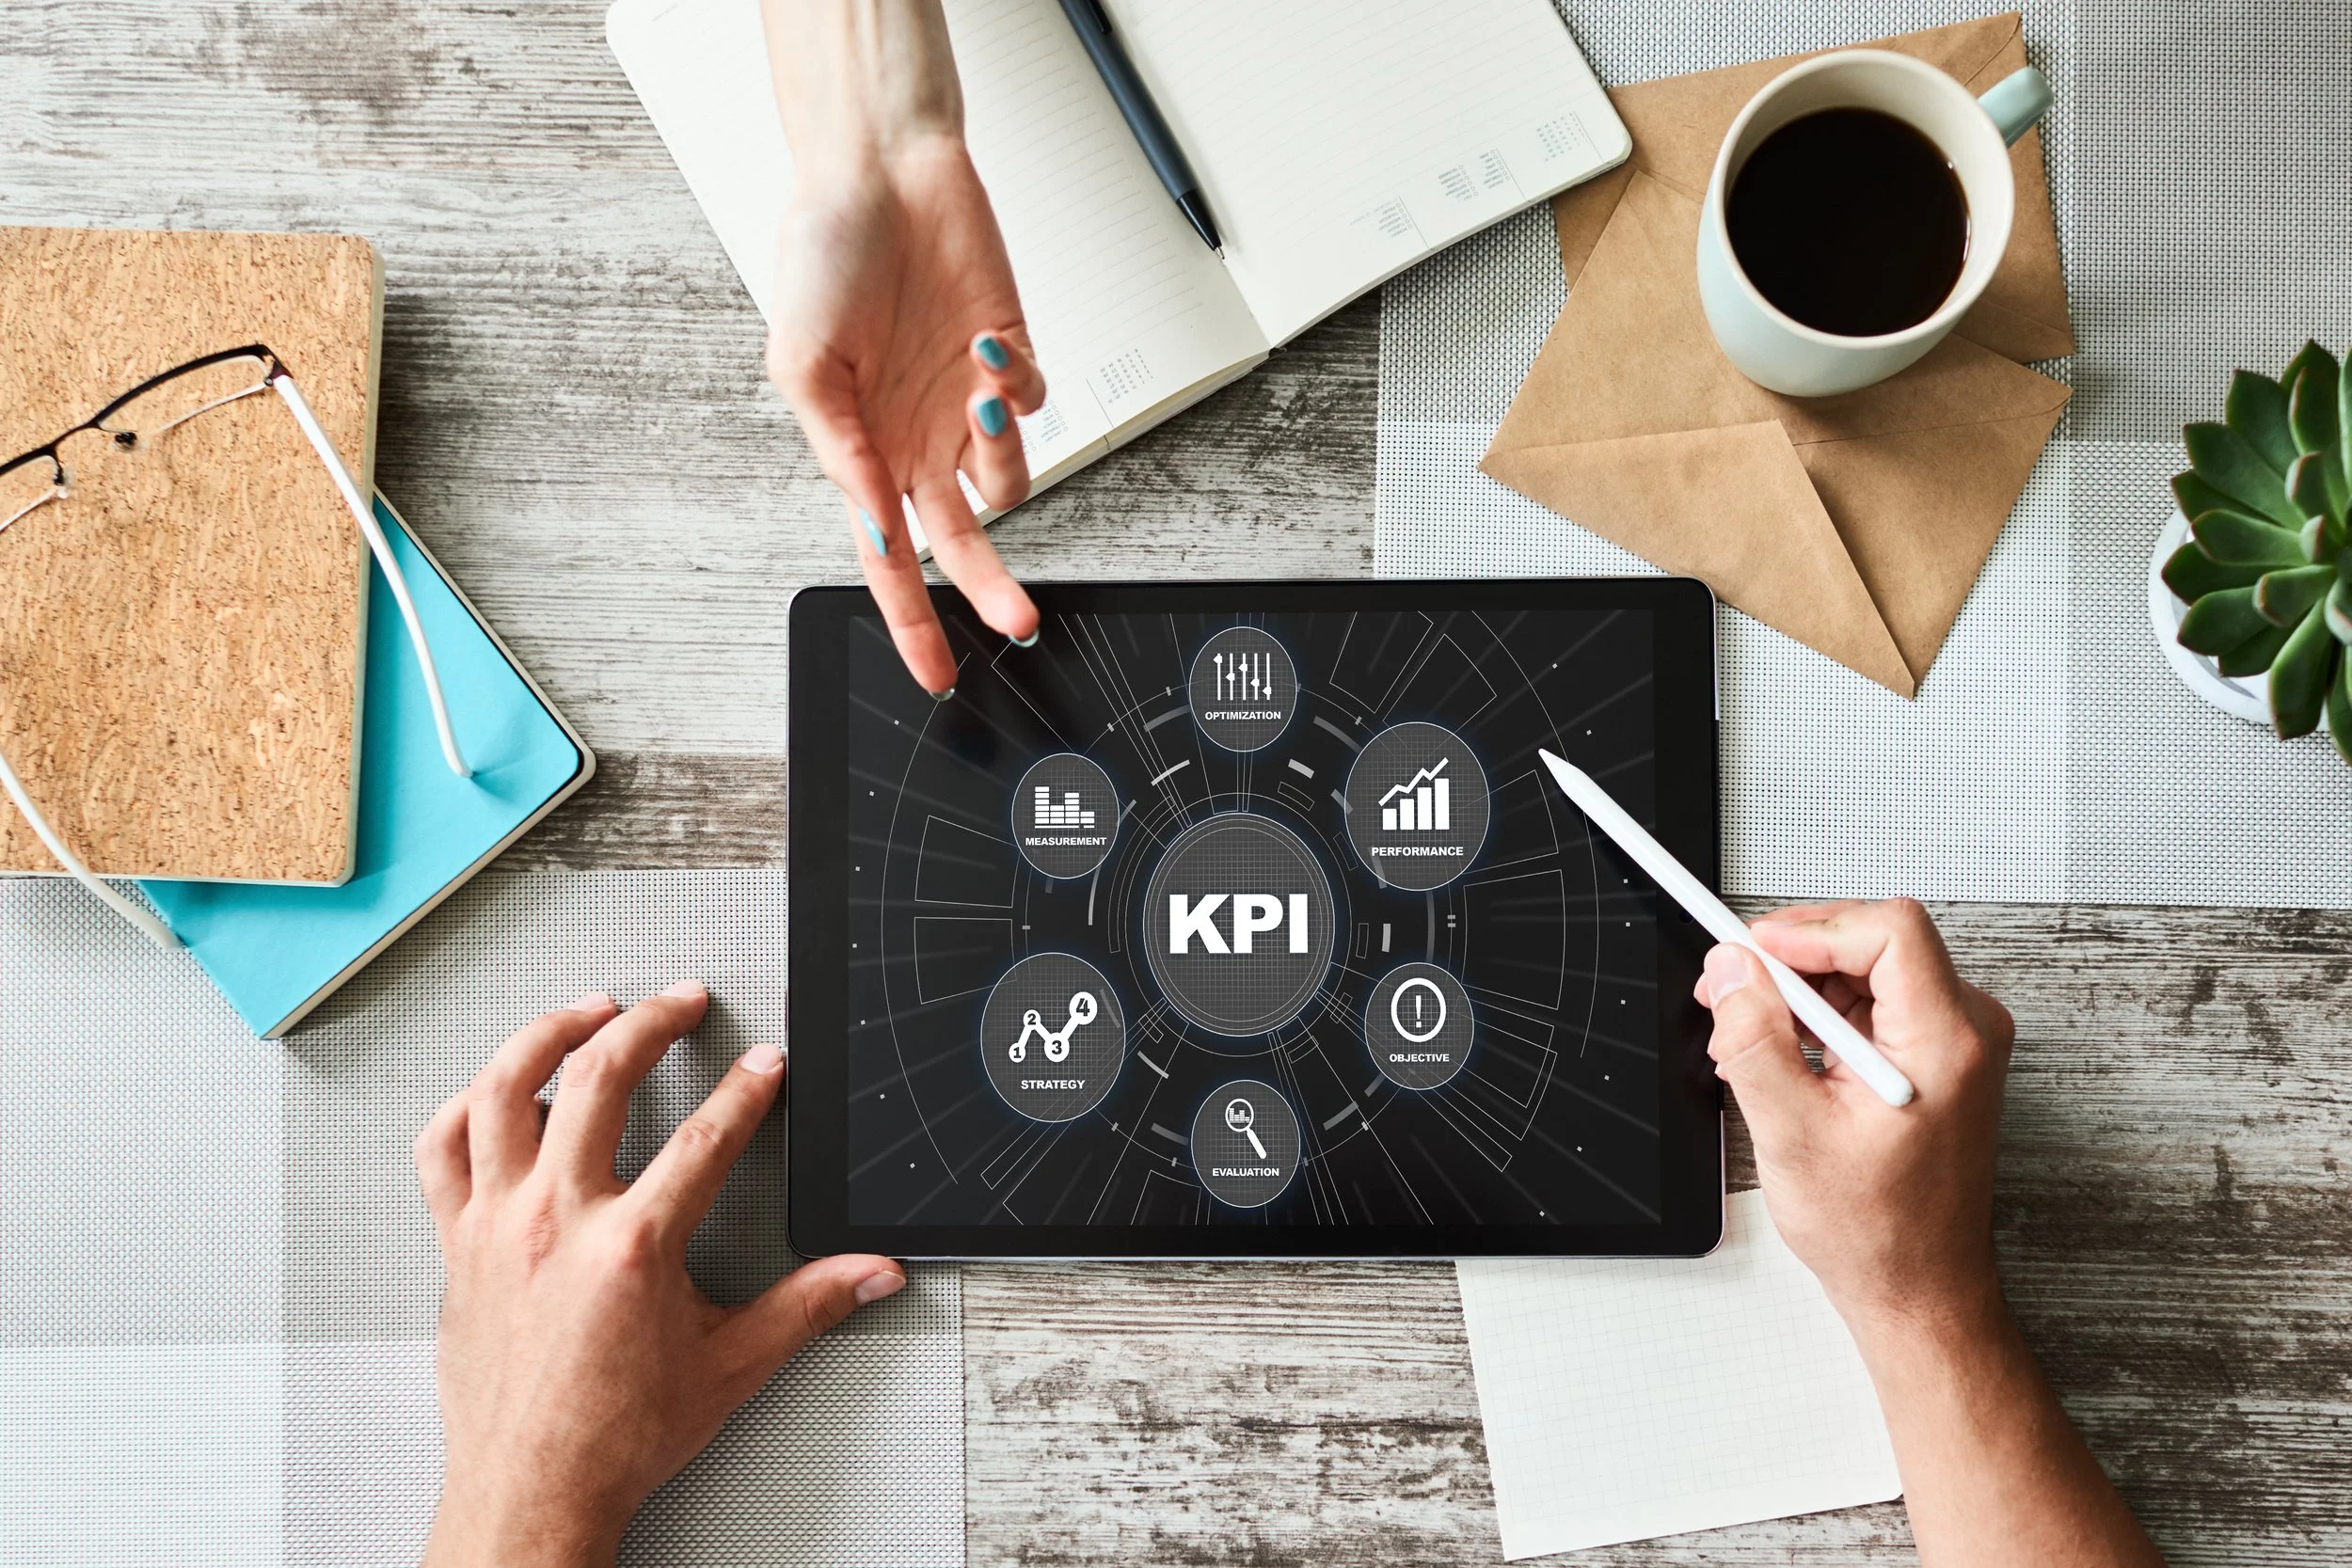
KPI stands for Key Performance Indicator. They’re metrics or values that help businesses measure their performance or success in achieving their objectives. KPIs will vary depending on the nature of the business activity and they can be high level, measuring the overall performance of a company or focus more on specific aspects of a specific activity, like marketing, finance, sales or website traffic.
KPIs are a very important part of business intelligence and if you’d like to know more about what they are and how to define them, you can find out more here.
7. Dashboard
Next up we have Dashboard. Now these are the end product, if you like, of the Business Intelligence process. Dashboards are reports that offer an at-a-glance snapshot of a businesses’ KPIs and aggregated data. It’s this at-a-glance characteristic that differentiates dashboards from traditional reports which tend to be more narrative in nature.
Dashboards are single screen reports that are often, though not always, connected to live data and being constantly updated.
Whereas a car dashboard displays things like how fast you’re going, how much is left in the tank or the outside temperature, a Business Intelligence dashboard displays things like revenue, stock levels and social media engagement.
Learn our 7 Top Tips For Better Dashboard Design


